
One of the most challenging aspects of being a prudent investor is recognizing the difference between short-term noise and long-term evidence. With billions of market data points available instantaneously 24/7/365, it’s easy to find yourself measuring what equates to a 26.2-mile journey with a 12” ruler. The investment industry and its corresponding news cycle aren’t much help here. We’re naturally conditioned to look at investment “results” in statistically noisy and historically very short time periods: calendar quarters, calendar years and even 3 to 5-year time frames.
Remember this helpful adage: Long Term is probably LONGER than you think [no matter what you’re thinking]. Long term is almost certainly longer than whatever the talking head on TV or the investment news article author is relying on to grab your attention.
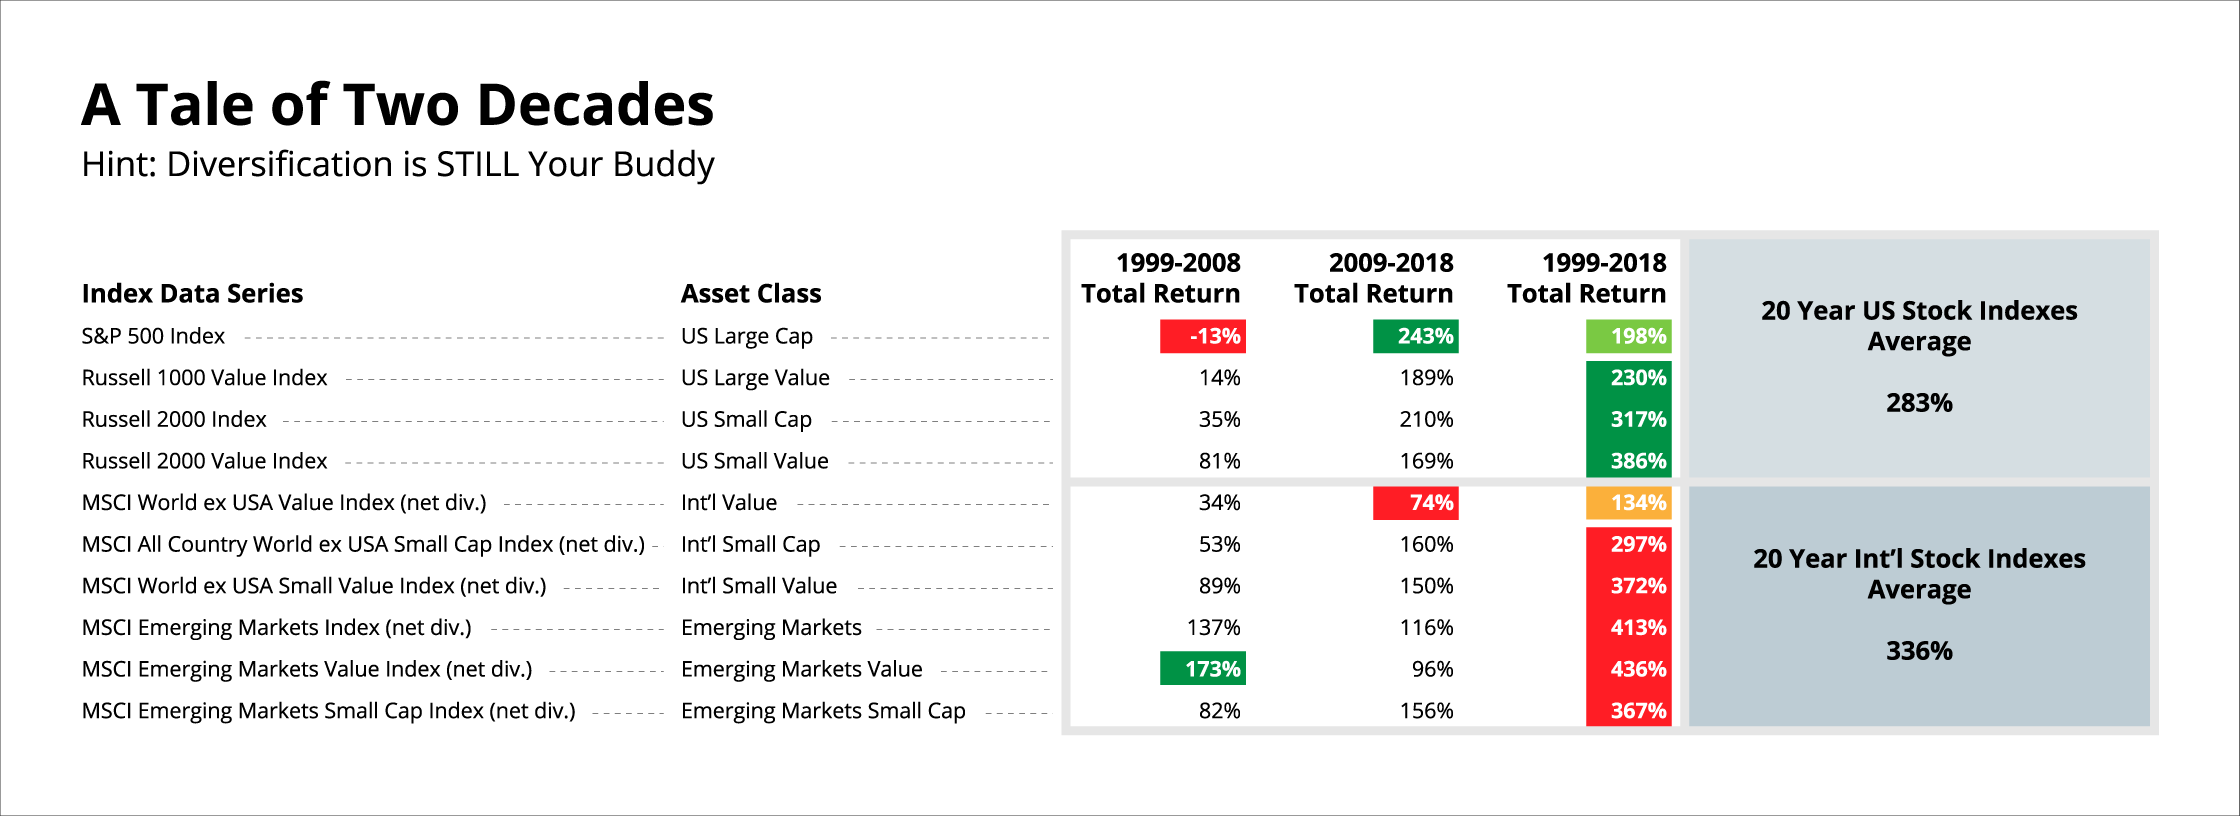
Global Stock Market Performance Perspective
The table below shows the cumulative, total performance of several US, international developed and emerging market indices over the preceding two decades ended December 2018. The combined 20-year period is shown in the last column. These two decades provide an interesting perspective, particularly when it comes to the often-referenced S&P 500 index. If you’ve attended my classes, we spoke of the ‘dead decade’: 2000-2009 for the S&P. As this chart demonstrates, markets are not static. Who knew (ahead of time) the last decade would be such a boom for the S&P?
Beware of Recency Bias
On January 1, 2009, there was no way to know with any degree of certainty what we now know about the most recently-ended decade. What seems “obvious” today, given the current facts and circumstances is mostly just a product of hindsight. The danger is in allowing recent events and facts to have greater impact on our decision-making about asset allocation going forward.
This phenomenon, known in behavioral science as Recency Bias, is a mental and emotional challenge every investor faces. Be on the lookout for it as you hear and read economic and investment-related news. More importantly, beware that it doesn’t creep into your own thinking about how your investment strategy should be structured going forward.
The future is just as new and unknowable as it was 10 or 20 years ago. The fact that US Large Cap stocks were the best performing asset category the last 10 years should not influence our commitment to mathematical diversification across global markets.
Remember, as we consistently suggest, diversification without discipline is just guessing. True diversification means owning asset categories we know IN ADVANCE will not be the “best performers” over some time period. As the data in the study illustrates, in order to have a high probability that you’ll own the best performing asset category WHEN it’s the best performer, you must stay committed to owning all 10, all the time. I’ll be putting together an ebook on this topic soon, so stay tuned for more information on “Diversification: A Tale of Two Decades”.
Diversification keeps you from speeding beyond your risk capability. If you’re not sure how fast you’re driving that portfolio, call us for a check up.

